The Competitive Edge: Why Industry 4.0 is Essential for Modern Manufacturing
In the high-stakes world of global manufacturing, the “old way” of doing things—relying on siloed data, reactive maintenance, and rigid production lines—is no longer just inefficient; it’s a business risk.
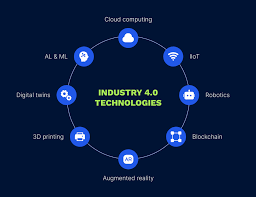
As we navigate through 2026, Industry 4.0 has moved from a “futuristic concept” to the baseline for survival. But why is it considered the ultimate tool for competitiveness? Let’s break down the strategic pillars that make the Fourth Industrial Revolution essential.
1. Turning Data into a Strategic Asset
In Industry 3.0, factories generated data, but it usually lived in isolated “silos.” Industry 4.0 breaks these walls down through Horizontal and Vertical Integration.
-
-
Real-Time Decision Making: Instead of waiting for weekly reports, managers see live dashboards of machine health and production speed.
-
Democratized Information: From the shop floor to the C-suite, everyone has access to the same “source of truth,” allowing for faster pivots when market conditions change.
-
2. From “Fix it When it Breaks” to Predictive Intelligence
One of the biggest drains on manufacturing competitiveness is unplanned downtime. Industry 4.0 tackles this head-on with Predictive Maintenance.
Using IoT sensors and AI, machines can now signal for help before they fail.
-
The Result: A typical smart factory can see a 10% to 20% increase in production output and a significant reduction in maintenance costs. By avoiding the “emergency repair” rush, companies save on both labor and expensive last-minute parts.
3. The Power of “Mass Customization”
The modern consumer doesn’t want “one size fits all.” They want products tailored to their specific needs. Traditionally, customization was expensive and slow.
Industry 4.0 introduces Agile Manufacturing:
-
Flexible Lines: Using collaborative robots (Cobots) and modular workstations, a production line can switch from Product A to Product B with minimal human intervention.
-
3D Printing (Additive Manufacturing): This allows for complex, customized parts to be produced on-demand without the need for expensive new molds or tooling.
4. Solving the Talent Gap and Empowering Workers
The manufacturing sector is facing a global skills gap. Industry 4.0 isn’t about replacing humans with robots; it’s about augmenting human capability.
-
Augmented Reality (AR): New workers can use AR headsets to receive step-by-step visual instructions overlaid on a machine, drastically reducing training time.
-
Shift to High-Value Tasks: By automating repetitive and dangerous “3D” jobs (Dull, Dirty, and Dangerous), companies can shift their workforce toward creative problem-solving and strategic planning.
5. Sustainability as a Competitive Requirement
In 2026, sustainability isn’t just “good PR”—it’s often a regulatory requirement and a way to lower costs.
-
Energy Optimization: AI can monitor a factory’s energy “footprint,” dimming lights or powering down non-essential systems during peak tariff hours.
-
Resource Efficiency: Smart sensors reduce material waste by ensuring quality control happens in real-time. If a part is slightly off-spec, the machine stops immediately, preventing a whole batch of waste.
Summary: The Cost of Doing Nothing
As the global Industry 4.0 market is projected to reach over $239 billion in 2026, the gap between “smart” and “traditional” factories is widening. Companies embracing these technologies are seeing:
-
7% to 20% increase in employee productivity.
-
10% to 15% unlocked capacity.
-
Enhanced supply chain resilience to withstand global shocks.
The Bottom Line: Industry 4.0 is no longer about “the factory of the future.” It is about the factory of now. Those who fail to integrate these cyber-physical systems risk becoming the “analogue” relics in a digital-first world.