Beyond the Percentage: The Three Core Metrics That Power Your OEE Score
Overall Equipment Effectiveness, or OEE, is the undisputed gold standard for measuring manufacturing productivity. It’s a single, powerful percentage that reveals how close your production process is to perfect. But the magic of OEE isn’t in that final score; it’s in the three core metrics that drive it: Availability, Performance, and Quality.
These three pillars break down your manufacturing losses into clear, actionable buckets, transforming a vague efficiency problem into a targeted improvement plan. A world-class OEE is typically considered to be 85%—but you can’t hit that target until you understand how these three components work together.
1. Availability: The Measure of Time Lost
Availability is the first pillar, and it addresses a fundamental question: How often is the machine available to run when it’s scheduled to?
This metric focuses entirely on Downtime Losses. It is the ratio of your machine’s Run Time (the time it was actually producing) to its Planned Production Time (the total time it was scheduled to run).
The Losses that Impact Availability
Availability loss occurs any time production stops for a significant period. These losses are primarily caused by the first two of the famous “Six Big Losses” in manufacturing:
- Unplanned Stops: Think equipment breakdowns, unexpected failures, major tool malfunctions, or material shortages. These are often reactive, unscheduled losses.
- Planned Stops: This category includes scheduled events that still reduce available production time, such as equipment setup, long changeovers, and planned maintenance.
- The Calculation
Availability is calculated as:
In short: If you have an Availability score of 90%, it means your equipment was sitting idle, waiting to run, for 10% of the time it was supposed to be working. Improving this score means reducing or eliminating both unplanned and planned stops.
2. Performance: The Measure of Speed Lost
Performance is the second pillar, and it answers a different critical question: How fast is the equipment running when it is available to run?
This metric focuses on Speed Losses. It compares your machine’s Actual Operating Speed to its Ideal Cycle Time (the maximum theoretical speed the machine can achieve).
The Losses that Impact Performance
Performance loss accounts for anything that slows your process down, even if the machine is still technically running. These losses correspond to the next two of the Six Big Losses:
- Idling and Minor Stops (Small Stops): These are brief, often unlogged stops—a machine jam, a sensor fault, or a quick hesitation—that operators might clear quickly. Individually small, these stops add up to significant lost time.
- Reduced Speed (Slow Cycles): This occurs when the equipment runs slower than its maximum rated speed, often due to wear and tear, substandard materials, or running at intentionally slower settings to avoid quality issues.
The Calculation
Performance is typically calculated by comparing the actual output to the theoretical maximum output in the time the machine was running:
In short: If you have a Performance score of 90%, it means that even when the machine was running, it was operating at only 90% of its maximum possible speed, whether due to micro-stoppages or intentionally running slow.
3. Quality: The Measure of Product Lost
Quality is the final, essential pillar, and it asks: How many of the produced items are “right the first time”?
This metric focuses on Quality Losses. It is the ratio of Good Units (products that meet specifications and do not require rework) to the Total Units Produced.
The Losses that Impact Quality
Quality loss accounts for defective parts and wasted material. It directly reflects the final two of the Six Big Losses:
- Process Defects (Scrap/Rework): This is any product that fails to meet quality standards during stable production. This includes parts that must be scrapped or require time-consuming rework.
- Reduced Yield (Startup Rejects): These are defective or scrap parts produced during the early stages of a production run, such as after a machine changeover or startup.
The Calculation
Quality is the most straightforward calculation:
In short: If your Quality score is 90%, it means that for every 100 parts you produced, 10 were defective or required rework, representing a loss of material, time, and capacity.
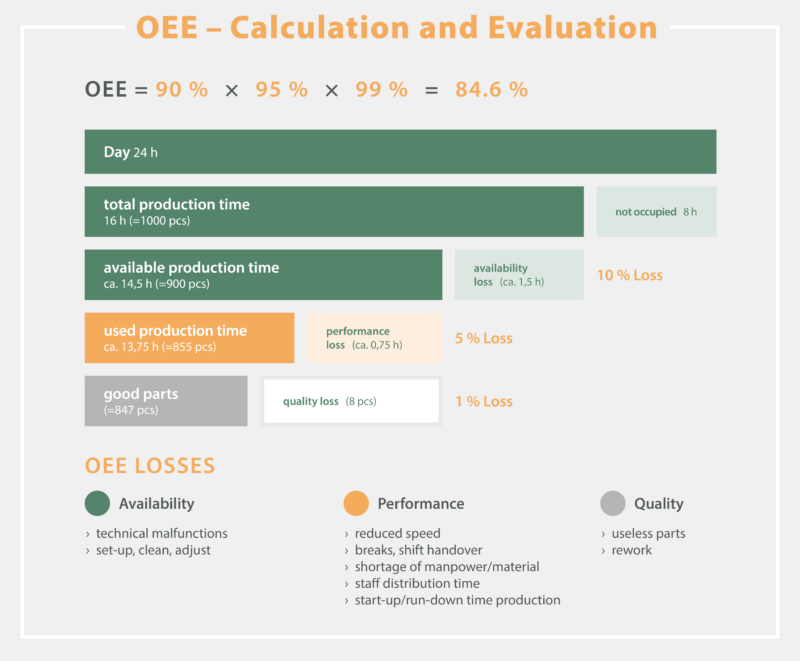
The Final OEE Calculation: A Powerful Product
The beauty of Overall Equipment Effectiveness lies in how these three metrics are combined. They are not simply averaged; they are multiplied together to get the final score:
This multiplication is what makes OEE such a powerful diagnostic tool. A slight dip in one area has a compounding effect on your final score, immediately highlighting the most significant opportunity for improvement.
For example, a process with:
- Availability: 95%
- Performance: 95%
- Quality: 95%
Results in an OEE of , or 85.7%—a world-class score.
However, a more typical process might look like this:
- Availability: 80%
- Performance: 85%
- Quality: 90%
This results in an OEE of , or 61.2%. This score immediately tells a manufacturer they are wasting nearly 40% of their potential productive capacity, and the individual metrics point directly to the area where the most time is being lost: Availability (Downtime).
By focusing on these three core metrics, you move beyond simply measuring productivity and start taking targeted action to achieve manufacturing excellence.